Module 3: Intro to 1D Motion
Kreshnik Angoni
Module 1D Motion Worksheet.docx
Module 1D Motion Worksheet.pdf
Other Resources:
- Haliday & Resnick, Fundamentals of Physics 2.1-2.6;2.10
- Openstax
Kinematics is the study of motion, without paying attention to the reason why it happens (that will come later = force)
Simply put, it uses one set of physical quantities (position: coordinates, velocity and acceleration) to describe motion without the forces that cause it.
A good overview video: also follow the video sequence for more detail
ONE DIMENSIONAL KINEMATICS
Introduction
In this course we will be looking at two basic types of motion: translation, and rotation . Note that in both translation and rotation there is no deformation; the object shape and dimensions remain the same.
Translation: All points in the object move in the same way. For each point of the object, the final position can be found by using the same displacement vector (fig.1). Basically the object is moving in straight lines
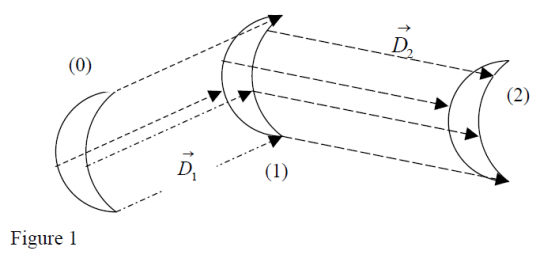
The same displacement vector shifts each object point from position (1) to position (2).
Rotation: The object rotates i.e. it changes its orientation in space. Each point on the object point has a different displacement vector. Even if a rotation is followed by a translation the displacement vectors are different (fig 2.b).

Figure 2.b: Rotation followed by a translation or vice-versa.
Often, in real life, the two types of movement combine together. For instance, an asteroid tumbling through space: rotating as it moves forward, or a football being thrown with spin.
However, we often study them separately, taking a complicated situation and making it easier to understand by building a physical model for each motion.
In this chapter we will deal only with movement along a fixed direction in space (one dimension, 1-D translation).
As mentioned above, in a translation, all object points have the same displacement vector. This simplifies greatly our work; “We study the movement of just one point in the object and the results apply over the object as a whole”. So, one uses a particle motion as a model for the object motion.
Displacement Versus the Traveled Distance
Consider an object (plane, car..) moving along a straight line (1D). We model this motion by a particle in motion along an axis. To define the position of this particle, we need only one axis. So, we select:
- A Frame origin O
- A Positive direction
- A Length unit "m"
- A Time unit "sec"
- Define t=0 at the initial location (the initial conditions of the motion)
Figure 4 presents the 1-D motion of an object. The particle in the model starts its motion at time = 0sec and at position = +1m. It moves 4m right, turns and stops at = -3m. The motion lasts for 2sec.
We define the particle displacement as
where is the final location and is the initial position.
That is to say the displacement depends only on where you begin and where you end. It is independent of the path
Note that we are dealing with vectors here!
Note that if the particle is shifted along in the positive x direction and if it is shifted in the opposite direction (going in the negative x direction).
Remember: The displacement is not the same as the travelled distance which is always positive. In the case of figure 4, the travelled distance is 4 + 8 = 12m while the displacement is .

Velocity Versus Speed
How fast is a particle moving? In everyday vocabulary one uses the speed (positive scalar) to answer this question in the case of cars, planes etc. If one does not have specific information about the way the particle is moving in particular portions of its path, one has to refer to the average speed along the path:
The average speed along the path is always a positive scalar.
- Example: In the upper mentioned example of 1-D motion, one would find: average speed = 12m / 2sec = 6m/sec.
In physics, one uses the velocity (vector) to describe the way a particle is moving. For 1D motion along Ox one starts by defining the average velocity:
Note that the velocity may be negative or positive.
- Example: In the 1-D motion example, Vav = -4m / 2sec = -2m/sec, which is different from the average speed (6m/sec).
Remember: Although the speed and velocity have the same units (m/s in SI) they are very different. Speed comes from distance travelled, a scalar quantity, velocity comes from the displacement, where you begin to where you end, a vector quantity.
Note: The displacement and the velocity are both positive when the particle moves along direction (along the positive x axis).
When the particle moves along opposite direction , they are both negative.
Very often one uses the graph to present the history of a particle motion. The figures 5 & 6 present two such graphs. The average velocity is calculated easily from the slope at these graphs. In the graph of figure 5, it does not depend on initial moment or the length of time interval. The motion follows all time with the same velocity. In the graph of fig. 6, we see that average velocity increases for smaller time interval ( ~ equal, smaller). So, does not offer good information for all situations.
For instance, imagine I throw a ball to you, there will be a displacement for the ball and a change in time. Now imagine I throw the ball, and an eagle swoops down, grabs the ball, flies around with it before dropping it for you to catch. The displacement is the same as the first case, but the time is much longer. This average velocity will not be very useful!

Figure 6: The particle moves at a changing velocity.
Instantaneous Velocity
Imagine you are taking a bus trip to school. You could calculate the average velocity of the trip, which would be the displacement vector divided by the change in time for the trip. But the velocity itself will be changing over this trip, the bus will be stopping, starting, speeding etc. The bus driver can know the speed (and velocity since the bus has a direction) by looking at the odometer. You can calculate this velocity at any time by dividing up the trip into many small time intervals and looking at the displacement across these time intervals. When these small time intervals get really really small (approaching zero) the average velocity approaches the instantaneous velocity: essentially the velocity at a point in time. Although it is measured using points which straddle the time point in question.
Look at figure 7 which shows the position as a function of time. You can calculate the average velocity across different time intervals, represented as the slope of the straight lines. The figure show what happens when the time interval is made smaller and smaller. What happens to the slope?
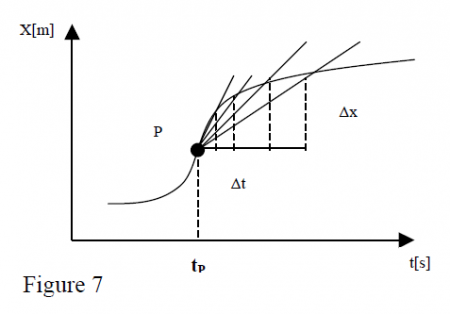
As you decrease the time interval, the slope starts approximating the slope of the tangent line of the function at point P. Taking this observation further, you may see that the best estimation for the velocity close to point P is the limiting value of the average velocity when the time interval goes to zero. This is the definition of instantaneous velocity at point P:

Don't Worry: This equation will make perfect sense to you when you cover this in your calculus courses. What you are doing is taking the derivative of the function. All you have to understand at this point is the concept of making the time interval very small makes the slope approximate the tangent slope at the time point.
Ready for this? Check out this video
How to get instantaneous velocity from a position vs. time graph
How to find a slope in 47s
As the velocity (derivative of the position function) is equal to the slope of the tangent of the curve at point P, you may find the velocity straight from the x vs. t graph.
The graph in figure 8 presents a motion along the x axis:
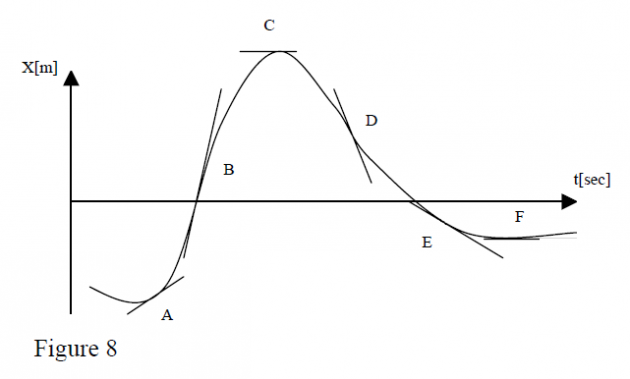
Point B: (larger); Faster motion along
Point C: ; Instantaneous rest, turn back point
Point D: ; Motion along
Point E: (smaller); Slower motion along
Point F: ; Long rest before turning back along
Not sure how this is working? Take a ruler and follow the curve line with it. You are finding the tangent at each point.
Every curve becomes a straight line if you are super close to it
Acceleration
In the popular vocabulary the word “acceleration” means "speed increase". In physics, it means simply a rate of change of velocity vector (magnitude, direction or magnitude & direction simultaneously). Knowing the relation for the motion of a particle, you can build the graph of instantaneous velocity versus time. If it is a straight line, the average acceleration is a constant and is sufficient for the velocity change description. However, such graphs may have different curved parts and one uses instantaneous acceleration.
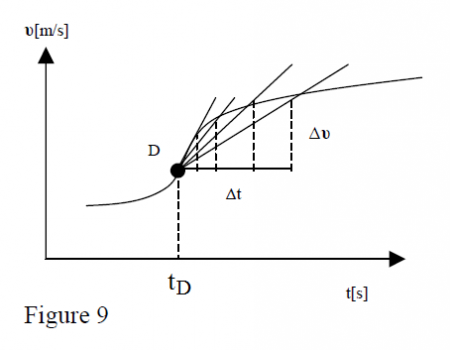
So, if the average acceleration is defined as
average acceleration = change of velocity / time interval or
Analogous to the instantaneous velocity, the instantaneous acceleration at point D is
The acceleration at any point D on the graph is equal to the graph slope at that point. The acceleration may be positive or negative. It is important to mention that the acceleration sign alone is not sufficient to understand whether the particle is speeding up or slowing down. To get this information, one must compare the sign to the sign. The following table describes all four possible situations.
| is POSITIVE | is NEGATIVE | |
|---|---|---|
| is POSITIVE | Velocity and acceleration have the same sign so the body is speeding up. Velocity is positive which means the motion is along . | Velocity and acceleration have opposite signs so the body is slowing down. Velocity is negative which means the motion is along . |
| is NEGATIVE | Velocity and acceleration have opposite signs so the body is slowing down. Velocity is positive which means the motion is along . | Velocity and acceleration have the same sign so the body is speeding up. Velocity is negative which means the motion is along . |
Remember: The direction of motion is always shown by the sign of velocity.
How to get instantaneous acceleration from a velocity vs. time graph
As the acceleration (derivative of the velocity function) is equal to the slope of the tangent of the velocity plot, you may find the acceleration straight from the v vs. t graph.
To get a better meaning of this, let's consider the and graphs in figure 10:
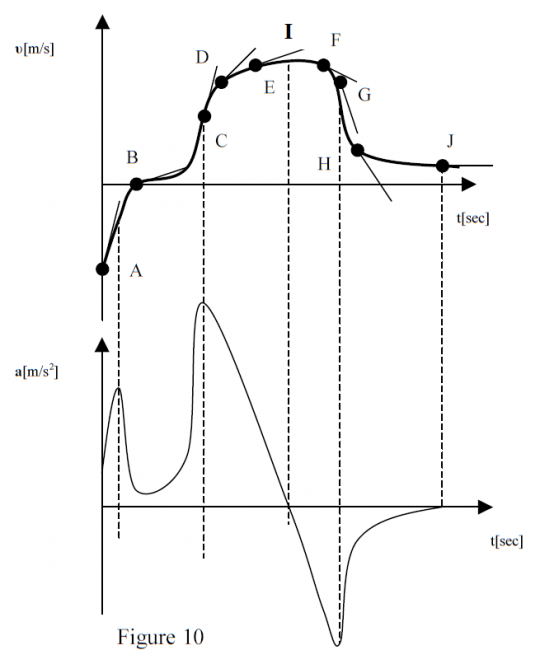
A-point: ; motion along
Since (opposite sign), there is "slowing down"
Between A & B: = max, (slope on ) = max; there is "slowing down"
B-point: , but ; this means instantaneous rest
Since , ready to move along
Between B & C: , ; motion along
C-point: max acceleration
Between C & E: ; motion along
Since but decreasing, slight increase
I-point: zero acceleration; instantaneous constant velocity
Between I & J: ; motion along
Since , there is "slowing down"
Between G & H: greater "slowing down" effect
Beyond G-point: the stopping effect decreases until it becomes zero at point J (constant velocity)
Notes: In real life the velocity cannot change instantaneously. This means that the acceleration has always a finite value (no infinite). At this level, we will study only motions with constant acceleration. To describe a 1-D motion with constant acceleration only ", , and " parameters are needed.
A simple way to distinguish an accelerated motion () from one with constant velocity (): Fix an interval of time (say 1sec) and measure the travelled distance for several successive intervals of 1 second. If the distances are equal, there is a motion with constant velocity (fig 11.a). If the successive distances increase (or decrease) by the same quantity, there is a motion with constant acceleration (fig 11.b). If the successive distances change differently, there is a change of acceleration.

Area under Kinematic Graphs
You have already seen how to find instantaneous velocity from a graph of x vs. t and acceleration from a graph of v vs. t by
using the slopes ( ) of tangents on the graph at points of interest. The following “inverse” situations happen
in practice, too:
a) Given the graph v vs.t find the location of particle x at a given moment t.
b) Given the graph a vs. t, find the velocity of particle v at a given moment t.
Finding the Area Under a Curve
Finding the location of particle at time t_2 from the velocity graph
Knowing that
(1) is a mathematical definition, while in physics, one deals
with measurable (small but finite) interval values , one uses ,
(2) for a real life velocity and , (distance=speed times time)
(3) For a motion with constant velocity (graph in fig. 1) one may
calculate the displacement from initial location (3)
As is the area of rectangle (fig.1), the displacement is equal to the area under the velocity
graph for the considered time interval. ( has displacement dimensions [m/s]*[s]=[m])

The result “displacement equal to area under velocity graph” is valid in all cases but the
way one calculates the area is more subtlet if the velocity is not constant (fig.2). One has to
calculate the area by using a set of ‘’extremely’’ narrow rectangles covering the area
under the graph as much as possible. You can probably tell that this method is more precise when using tiny time intervals .
The figures 3,4 show two possible velocity graphs. As the area under the graph in fig.3 is a positive
value, it meand that (the displacement is positive)and . This means that the particle is moving along the
positive x axis. In fig. 4, the area under the graph is negative, so we have
and . This means that the particle is moving along the negative x axis.

B] Finding the velocity of particle at the “moment t2 “ from the acceleration vs t graph
Similarly, if one has an a vs t graph, one may calculate the change of particle velocity by the area
under the graph. In the frequent case of motion with constant acceleration (figure 5.a,b), one may easily
calculate the velocity at any moment (F-final) if one knows it at an initial (I) moment of time.
The definition for acceleration is (4)
As “a” is constant one can express it by “initial and final values” (5)
So, (6)
The time interval being positive, a-sign shows if the velocity value2 increases (5.a) or decreases (5.b).

Even when “a” is not constant, the area under the a(t) graph gives the change of velocity but in these
cases the velocity does not change linearly with time (Ex. we will see later at “harmonic oscillations”).