Problem solving using equations of motion
Helena Dedic
Exercise 1
Amminder is driving a car at 120 km/hr along a straight highway when he sees an accident ahead and must hit the brakes to stop the car in 50 m. He managed to stop the car.
a. What was the acceleration of the car?
b. How long did it take to stop the car?
Solution:
We will begin by converting the units:
We sketch a diagram of the event and a - t graph.
In this problem we have no idea about the timing of the events but we know the velocity at the beginning and at the end. It is most useful to use the equations of kinematics.
a. To find the acceleration we will use:
b. Knowing the acceleration we can find how long did it take to stop the car
Exercise 2
A bicycle goes from rest to 36 km/hr in 4 minutes, maintains speed for 5 minutes then slows down to 18 km/hr in 1 minute. Convert km/hr to m/s and minutes to seconds.
Sketch a vx versus t graph for the motion.
What was the acceleration of the bike for
0 < t < 4 min?
4 < t < 9 min?
9 < t < 10 min?
0 < t < 10 min?
How far did it travel in the 10 minutes?
What was its average velocity for the 90 minutes?
Solution:
We will begin by converting the units - sample calculation:
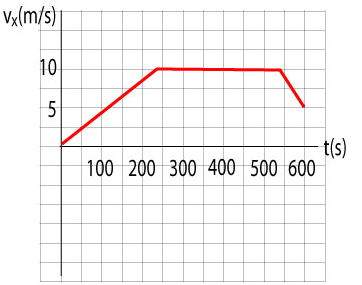
a. The bicycle starts from rest and therefore the graph begins at (0, 0). It reaches the velocity of 10 m/s in 240 s. The graph will be a straight line with a positive slope. Then the bicycle moves at constnat velocity for 300 s and thus the graph is a horizontal straight line. Then the bicycle decreases its velocity to 5 m/s in 60 s. The graph is a straight line with a negative slope.
b.
- a). The acceleration is the slope of the - t graph. The slope is
- b). During this interval of time the graph has a zero slope and therefore the acceleration is zero.
- c). We cannot compute the acceleration for this interval but we can compute the average acceleration
c. We cannot use equations of kinematics because the motion is not the motion with constant acceleration but we can use the area under the graph to compute the displacement. We may use the formula for an area of a trapezoid ((a+b)c/2)The total area under the vx - t graph is:
d. The average velocity is the displacement divided by the interval of time:
Exercise 3
Joe the race driver makes a pit-stop to refuel. After refueling, he pulls out with an acceleration of 6 m/s2. 4 s later, he re-enters the main track and is overtaken by Ralf driving his car at constant speed of 80 m/s.
a. Assuming that Joe maintains the constant acceleration, when and where will his velocity be the same as the velocity of Ralf's car?
b. When and where will Joe pass Ralf?
Solution:
We begin the solution by drawing a diagram of the situation: Joe (in the red car) leaves the pit with an acceleration of 6 m/s/s. Presumably, his car is at rest in the pit and gains velocity at a rate of 6 m/s every second. Thus, by the time he reaches the main track 4 s later his speed is v = 4 × 6 = 24 m/s.

In the diagram above we indicate this acceleration by drawing consecutive images (motion diagram) at increasing distances. Now, the instant he gets back onto the main track the blue car (Ralf) passes him with a constant speed of 80 m/s as indicated by equidistant consecutive images. At this moment the blue car is moving faster. But since Joe increases his velocity 6 m/s every second he will reach the speed of the blue car at some time . Joe will then move faster the blue car.
It is important to note, that by the time he has the same speed as the blue car, he is still behind because, until then, his car has been moving slower than the blue car (the blue car was still pulling away from him). But when his speed exceeds the speed of the blue car (after) he begins to gain on the blue car. Thus, at some time he catches up with Ralf and surpasses him. It is very likely, that Joe will move at constant speed himself from this instant.
We will draw v - t graphs for both cars. We choose the origin (t = 0) at the moment Joe gets back onto the track. The blue car (blue line) moves at constant velocity and thus the graph is a flat line at 80 m/s. The red car (red line) accelerates from 24 m/s at a constant rate and so the red line has slope equal to 6 m/s/s.
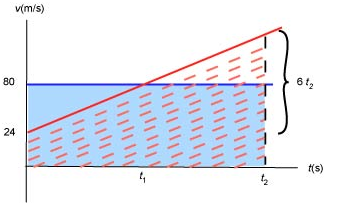
a. We can use the equation of kinematics to find the time when Joe reached the speed of 80 m/s:
and solve .
During this time, Ralf travelled the distance
=
and Joe travelled the distance
b. Now, the red car catches up with the blue car when both cars have moved through the same distance from the origin, which happens precisely when the corresponding areas under the blue and red graphs are equal. This happens at some time . But the area under the blue graph is equal to and the area under the red graph is equal to
Equating these, we get:
and simplifying:
Solving for we find .
Thus Joe catches up with the red car 18.7 s after he re-entered the main track or 22.7 s after he left the pit. During 18.7 s both the red and the blue cars travelled through a distance of 18.7 × 80 = 1496 m.
Exercise 4
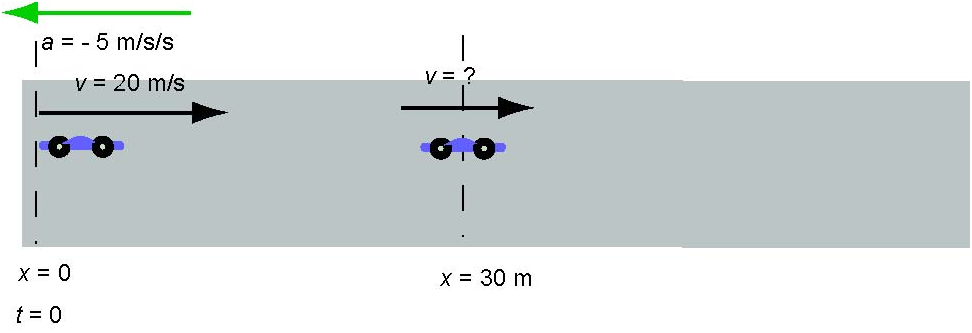
A car has an initial velocity of 20 m/s and an acceleration of. Find its average velocity in the time interval in which its displacement is 30 m from its initial position.
Solution:
To find an average velocity over an interval of time during which the displacement is 30 m we need to know how much time it takes to have this displacement. First we draw a diagram of the situation:
We can use the equation of kinematics to find the velocity the car has when it is 30 m from its initial position.
This solution indicates that the car will be twice at 30 m from its initial position - once when ti moves to the right as shown above. It will continue to the right, stop and then turn around to move to the left.
Therefore we need to use the equations of kinematics twice:
t = 2s
and
t = 6s
The average velocity in the first case is:
and in the second case
Exercise 5
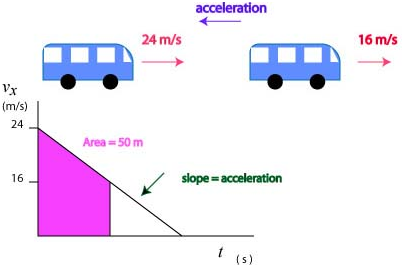
A bus slows with constant acceleration from 24 m/s to 16 m/s and moves 50 m in the process. (a) How much farther does it travel before coming to a stop? (b) How long does it take to stop from 24 m/s?
Solution:
First we draw a diagram of this situation:
We note that to answer these questions we need to have the slope of the graph. We can use the equations of kinematics to find the acceleration:
Then we can compute how much farther it travels using essentially the same equation, this time solving for the distance:
To determine how long does it take to stop from the beginning we use the equation for the velocity derived from the fact that the graph is a straight line:
Exercise 6
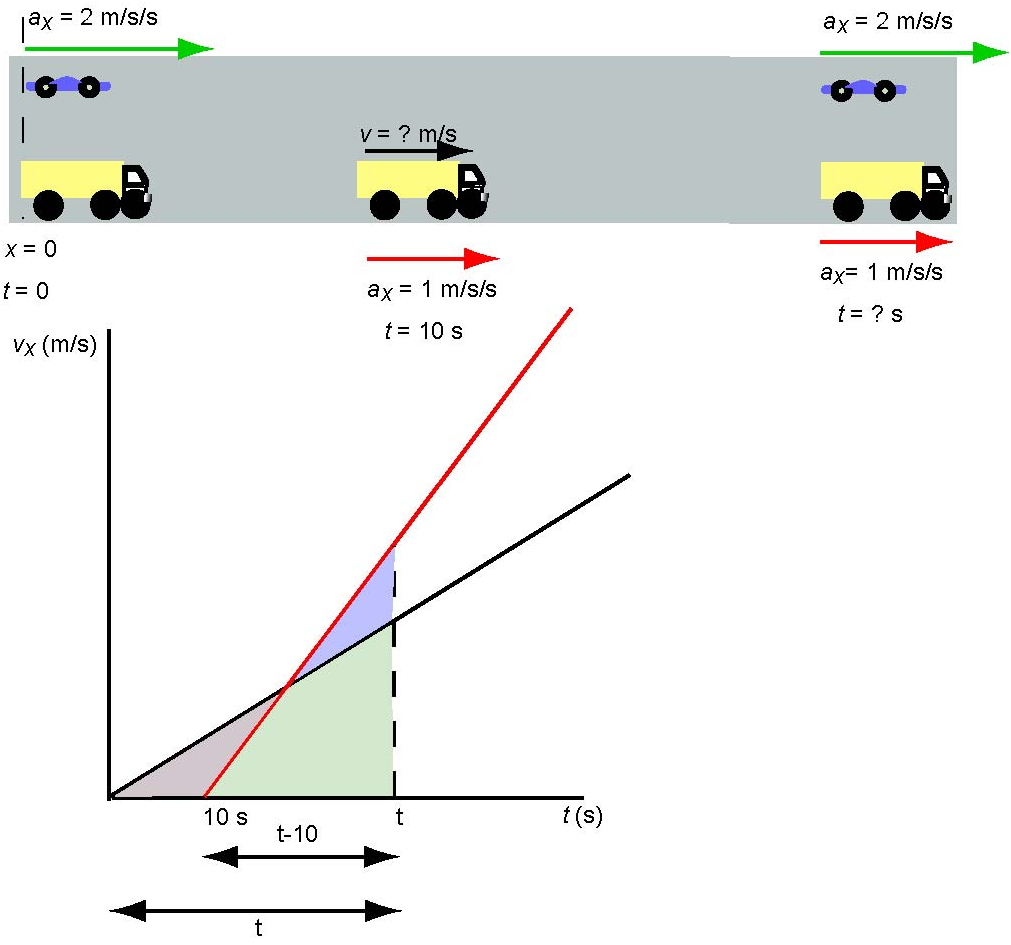
A truck starts from rest and accelerates at . Ten seconds later, a car accelerates from rest at the same point with an acceleration of . Where and when does the car catch the truck? What are their velocities when they meet?
Solution:
We will begin by drawing the diagram of this situation and then sketching the v - t graph. The truck starts from rest and accelerates at . 10 s later the car is still at rest while the truck has moved forward and has some speed. At some time t the car catches up with the truck. Both vehicles travelled the same distance but the truck took t s to get there while the car took (t - 10) s to travel this distance.
Considering the truck, the v - t graph is a straight line with a slope (see the black line in the graph above). It begins at the origin because the initial velocity of the truck is zero. The car begins 10 s later and accelerates at . Its graph is a steeper straight line (see the red line in the graph above). This line starts at t = 10 s on the t-axis because the car's initial velocity is also zero. The car will catch-up with the truck when the areas under both graphs are the same. Let's assume that this happens at some time t.
To find the displacement of the truck, we compute the area of a triangle which has a base t and the height equal to t because the velocity of the truck accelerating from zero and having the acceleration equal to one is equal to v(t) = 0 + 1 t = t.
The displacement of the car is equal to the area of a triangle which has a base equal to (t - 10) and height is equal to 2 (t - 10) because the velocity of the car accelerating from zero and having the acceleration equal to two is equal to v(t) = 0 + 2 (t - 10) = 2 (t - 10). The fact that the two displacements are equal gives an equation:
We have to solve this quadratic equation to find t = 5.86 s, 34.1 s. The first solution is meaningless because the car did not move at this time. Therefore the car will catch-up with the truck at t = 34.1 s. In this time the truck and the car travelled the displacement of ½ x 34.12 = 583 m.
Exercise 7
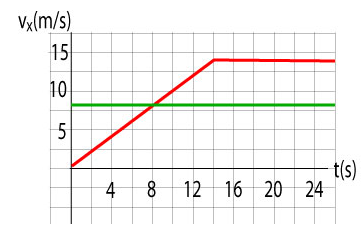
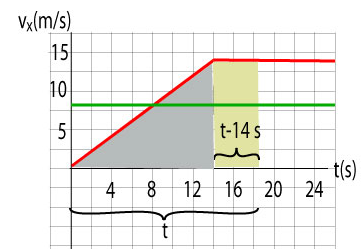
Cedric‘s car is stopped at a red light. Just as the light changes, Stephanie passes him on a bicycle at a constant speed of 8 m/s. Cedric floors the gas pedal to catch her but he must not exceed the speed limit of 14 m/s.
a. Sketch the - t graph of the motion.
b. When the car and the bike have the same velocity?
c. When and where Cedric catches up with Stephanie?
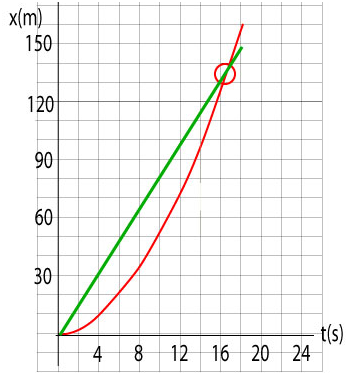
d. Use the - t graph to draw an x - t graph that shows the position of both the bike and the car.
e. Show on the x - t graph where the car catches the bike.
Solution:
a. The - t graph shows the motion of both the bike and the car.
b. The question is when Cedric has the velocity of 8 m/s. We can deduce his acceleration during the first 14 s from the slope of the vx - t graph. We find that he accelerates at 1 m/s2. Given that he gains 1 m/s every second we can conclude that he will have the same velocity as Stephanie in 8 s.
c. Cedric will catch up with Stephanie when they both have the same displacement. The displacement is the area under the graph. The inspection of the area of the bluish tringle (Cedric's displacement while he accelerates) is smaller than the rectangle under Stephanie's graph. It looks like that Cedric will have to travel some time t before he catches up with Stephanie. Cedric accelerates for 14 s and moves the distance ½ × 14 × 14 = 98 m. He then moves at 14 m/s for t - 14 s. His total displacement is
98 + 14 (t - 14).
In the meantime, Stephanie always moves at 8 m/s for t seconds and so her displacement is 8 t. Now we are ready to write an equation that equates the two displacements:
8 t = 98 + 14 (t - 14)
Solving for t we find
8 t = 98 + 14 t - 196
- 6 t = - 98
t = 16.3 s
This means that Cedric catches up with Strephanie
d. To plot the graph we construct the table
| t(s) | ||
|---|---|---|
| 4 | 32 | 8 |
| 8 | 64 | 32 |
| 12 | 96 | 72 |
| 16 | 128 | 126 |
| 20 | 162 | 182 |
The red hollow circle in the graph indicates that Cedric caught up with Stephanie 130.4 m from the red light.

